02 Nov Mean Stress Correction
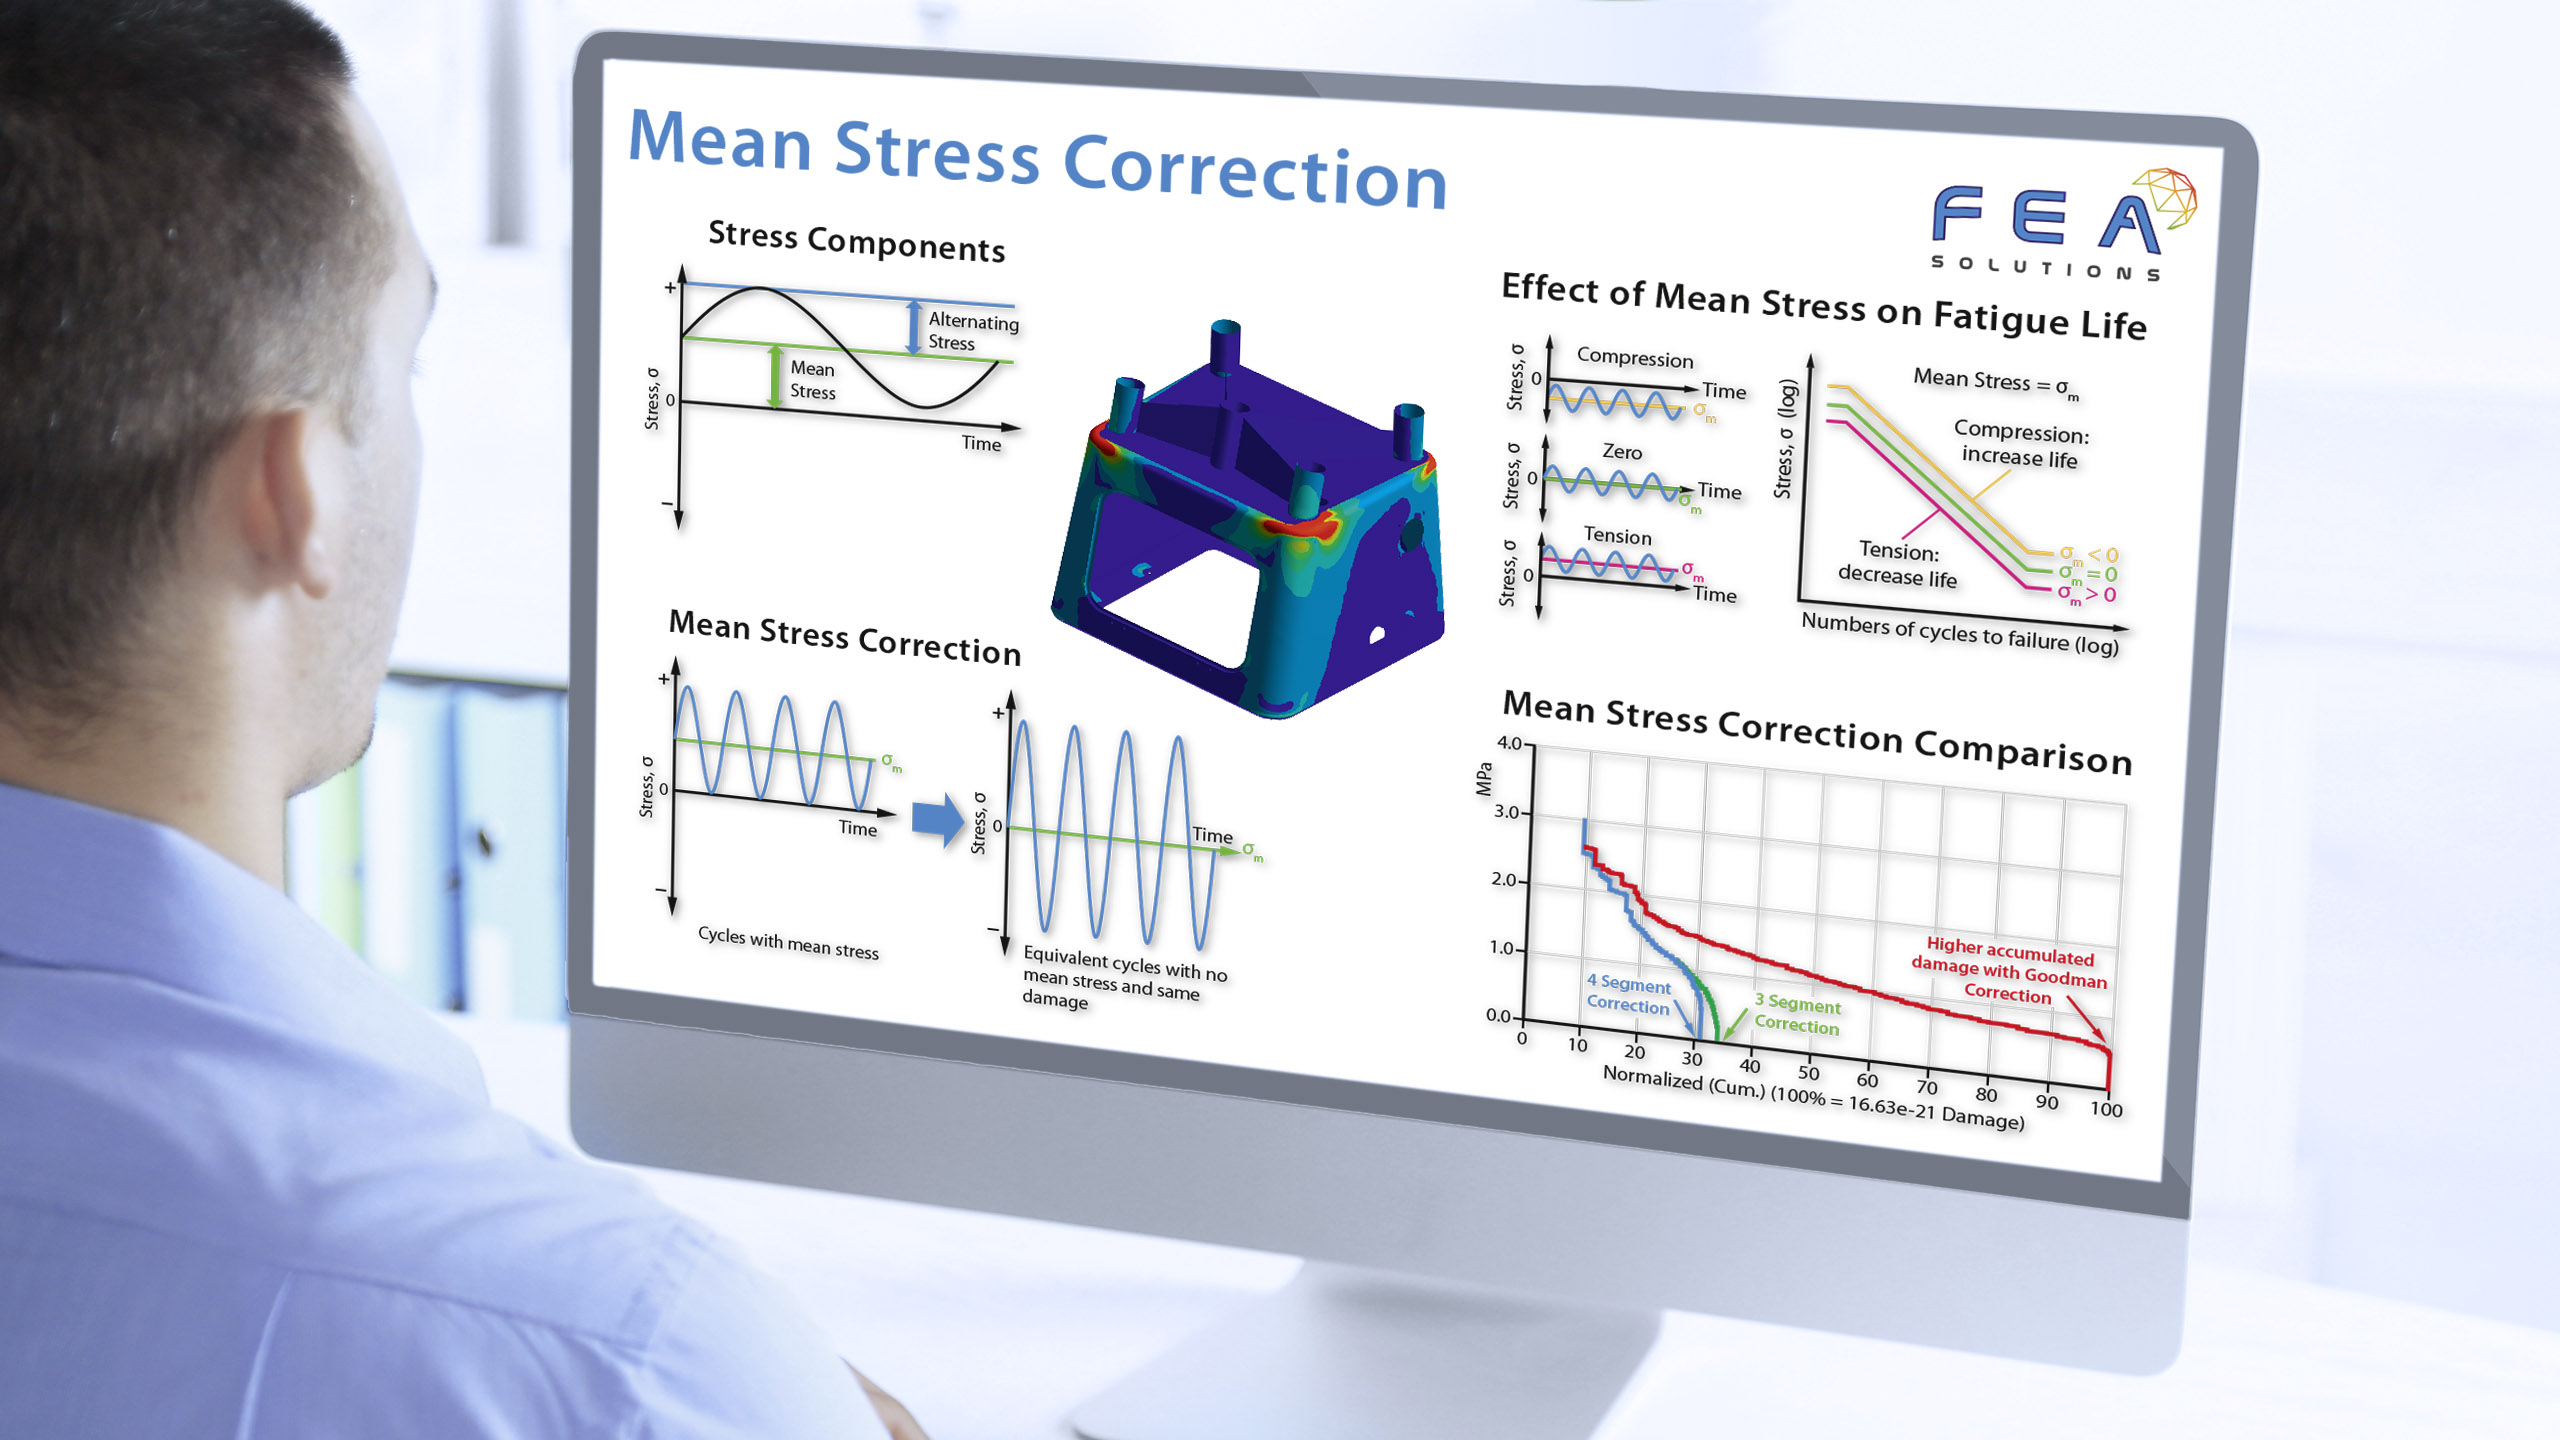
A fatigue load cycle is made of two components:
- Mean Stress – The average stress throughout the cycle.
- Alternating stress – This is the difference between the mean stress and the peak (minimum or maximum) stress in the cycle.
A fatigue analysis is conducted assuming that the mean stress is 0. This is due to the fact that the specimen tests (https://fea-solutions.co.uk/static-test-vs-fatigue-test/) used to derive S-N curves (https://fea-solutions.co.uk/s-n-curves/) and E-N curves (https://fea-solutions.co.uk/e-n-curves/) are only performed at a mean stress of 0. Performing them at other mean stress levels as well would further increase the already considerable complexity of fatigue tests. Instead of performing these additional specimen tests, the results of the fatigue analysis performed for a mean stress of 0 are adjusted by a mathematical procedure called mean stress correction.
There are different methods of Stress Correction, with varying levels of accuracy:
- Mean stress correction with Goodman Diagram.
- 3-5 Segment mean stress correction.
- Morrow mean stress correction.
- Smith-Watson-Topper (SWT) mean stress correction.
When conducting a stress based fatigue analysis (https://fea-solutions.co.uk/stress-based-fatigue-analysis/), the Goodman method is the most conservative. To get less conservative results, a multi-segment correction should be performed. The multi-segment approach is based on the Goodman correction and gets more accurate the more ‘segments’ are used.
The Morrow and SWT mean stress correction methods are used for strain based fatigue analysis (https://fea-solutions.co.uk/strain-based-fatigue-analysis/), with the Morrow being the less accurate of the two, whereas SWT providing conservative calculations in the low cycle fatigue regions of the E-N curve.
Please call us today on +44 (0)1202 798991 for any engineering analysis requirements you might have.